在WEB应用的开发里,就常用ECharts来做报表,样式美观,使用简单,同类型的报表工具,还有fusioncharts,highcharts这里就不展开多说他们了。
现在有做RN的应用,同样也选择了使用ECharts, 项目地址为:https://github.com/somonus/react-native-echarts, 对于如何集成与使用,官方已经说明,但在使用过程中,遇到了两个相对较大的坑。
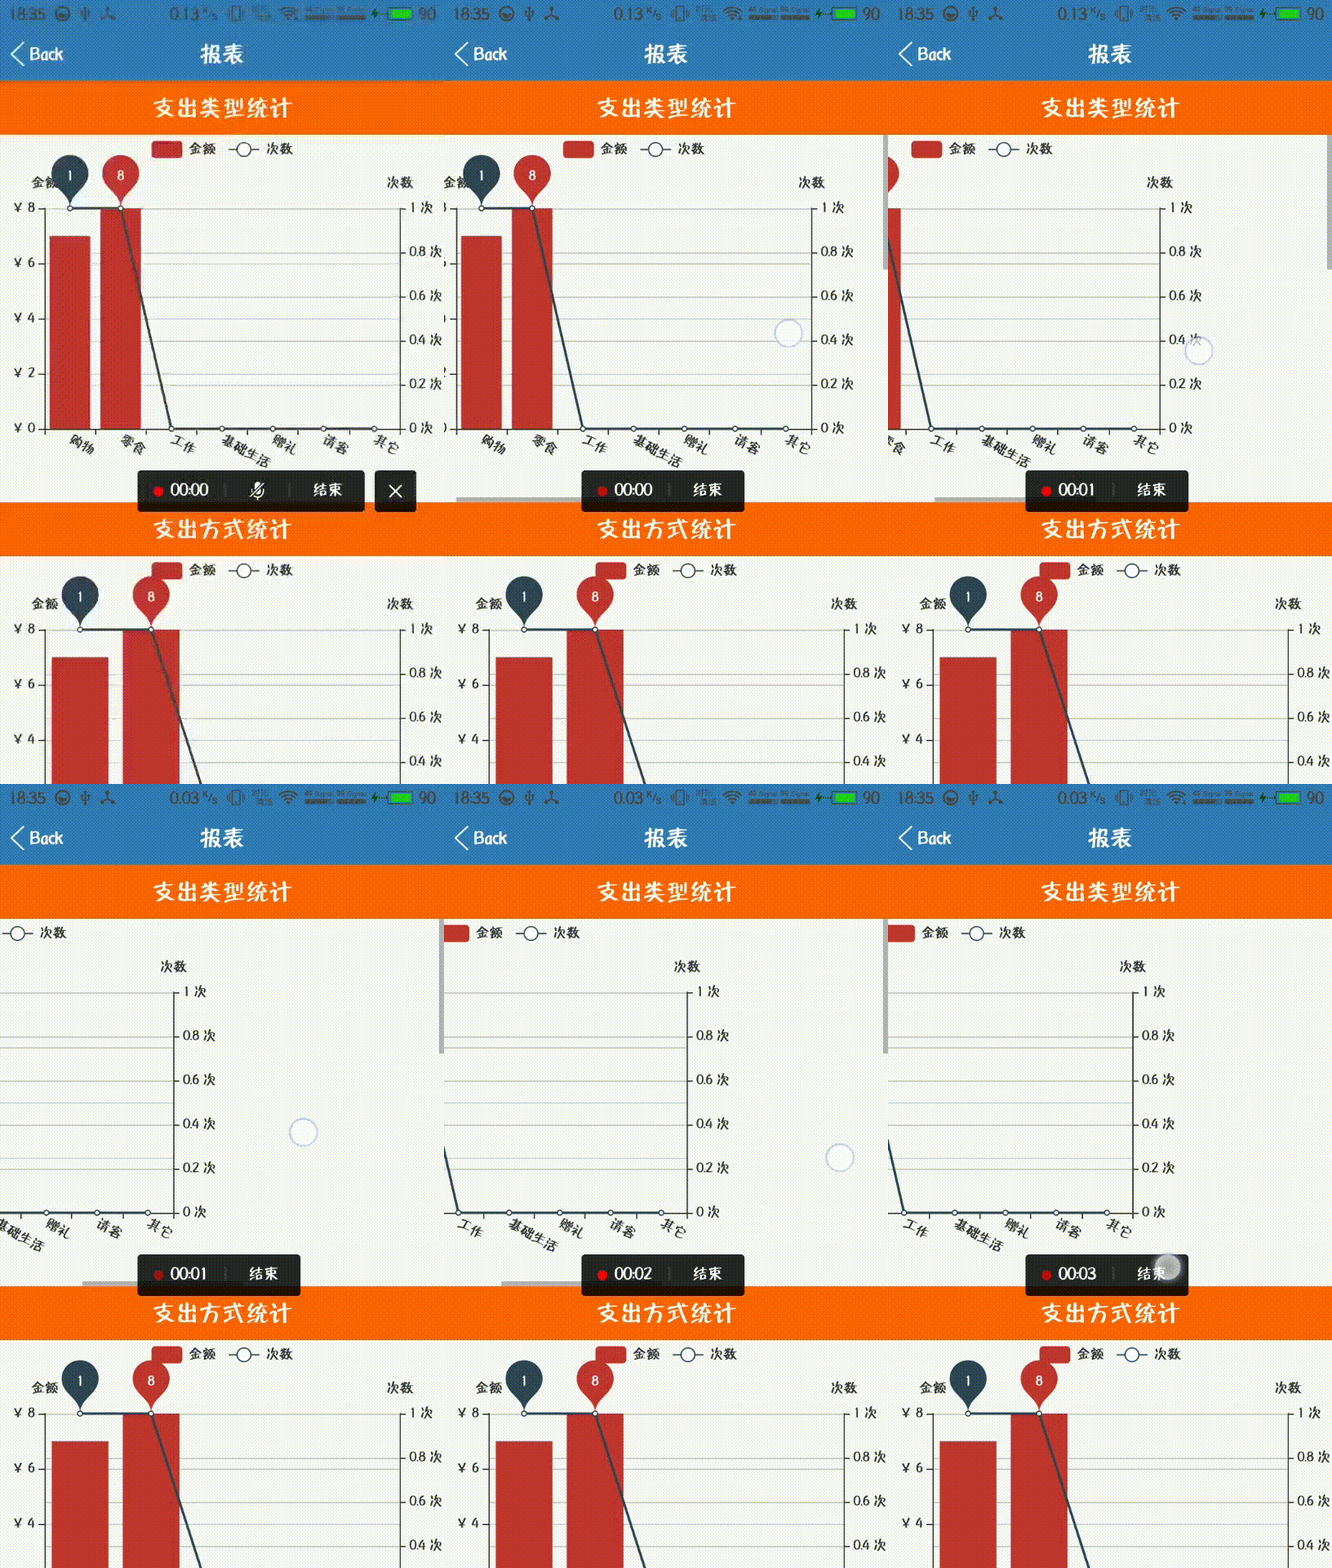
在集成好ECharts之后,写了第一个界面但发现宽度设置好了之后,在展示页面,依旧可以左右划动,划动看到的结果是一个空白页,具体表现如下:

通过滚动条可以看到,可划动的范围还是很长的,如果划完的话,将是一个完全空白的页面,寻找了一圈解决方案之后,在官方地址的issue列表里面有人提到了这个问题,安卓虚拟机下,charts可以滑动的问题,具体的做法如下:
先找到node_modules\native-echarts\src\components\Echarts 的index.js,对其WebView的参数做修改,下面是我的修改结果:
render() {
let scalesPageToFitValue;
Platform.OS === 'ios' ? (scalesPageToFitValue = false) : (scalesPageToFitValue = true);
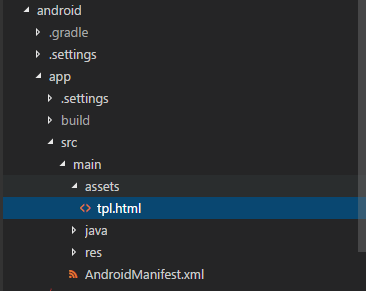
let source = (Platform.OS === 'ios') ? require('./tpl.html'): {'uri':'file:///android_asset/tpl.html'}return (
<View style={{flex: 1, height: this.props.height || 400,}}>
<WebView
ref="chart"
scrollEnabled = {false}
injectedJavaScript = {renderChart(this.props)}
style={{
height: this.props.height || 400,
backgroundColor: this.props.backgroundColor || 'transparent'
}}
scalesPageToFit={scalesPageToFitValue}
// source={require('./tpl.html')}
source={source}
onMessage={event => this.props.onPress ? this.props.onPress(JSON.parse(event.nativeEvent.data)) : null}
/>
</View>
);
}
对不同平台设置不同的scalesPageToFit值即可。

legend : {
data : [ '金额', '次数' ]
},
xAxis : {
data : xAxisData,
axisLabel:{
interval:0,//横轴信息全部显示
rotate:-30,//-30度角倾斜显示
}
},
yAxis: [